
Diversity
library(tidyverse)
library(scales)
library(foreign) # this package allows reading of .sav files
library(wesanderson)
library(ggrepel)
library(pewmethods) #this package allows exploration of Pew Research Center survey data
library(emo) # for rainbows and unicorns
Motivation to do this comparison
Given that we are in pride month 🌈, I came across this article, where it was really great to see increase trend for homosexuality, and not so great to see low accpetance in some regions.
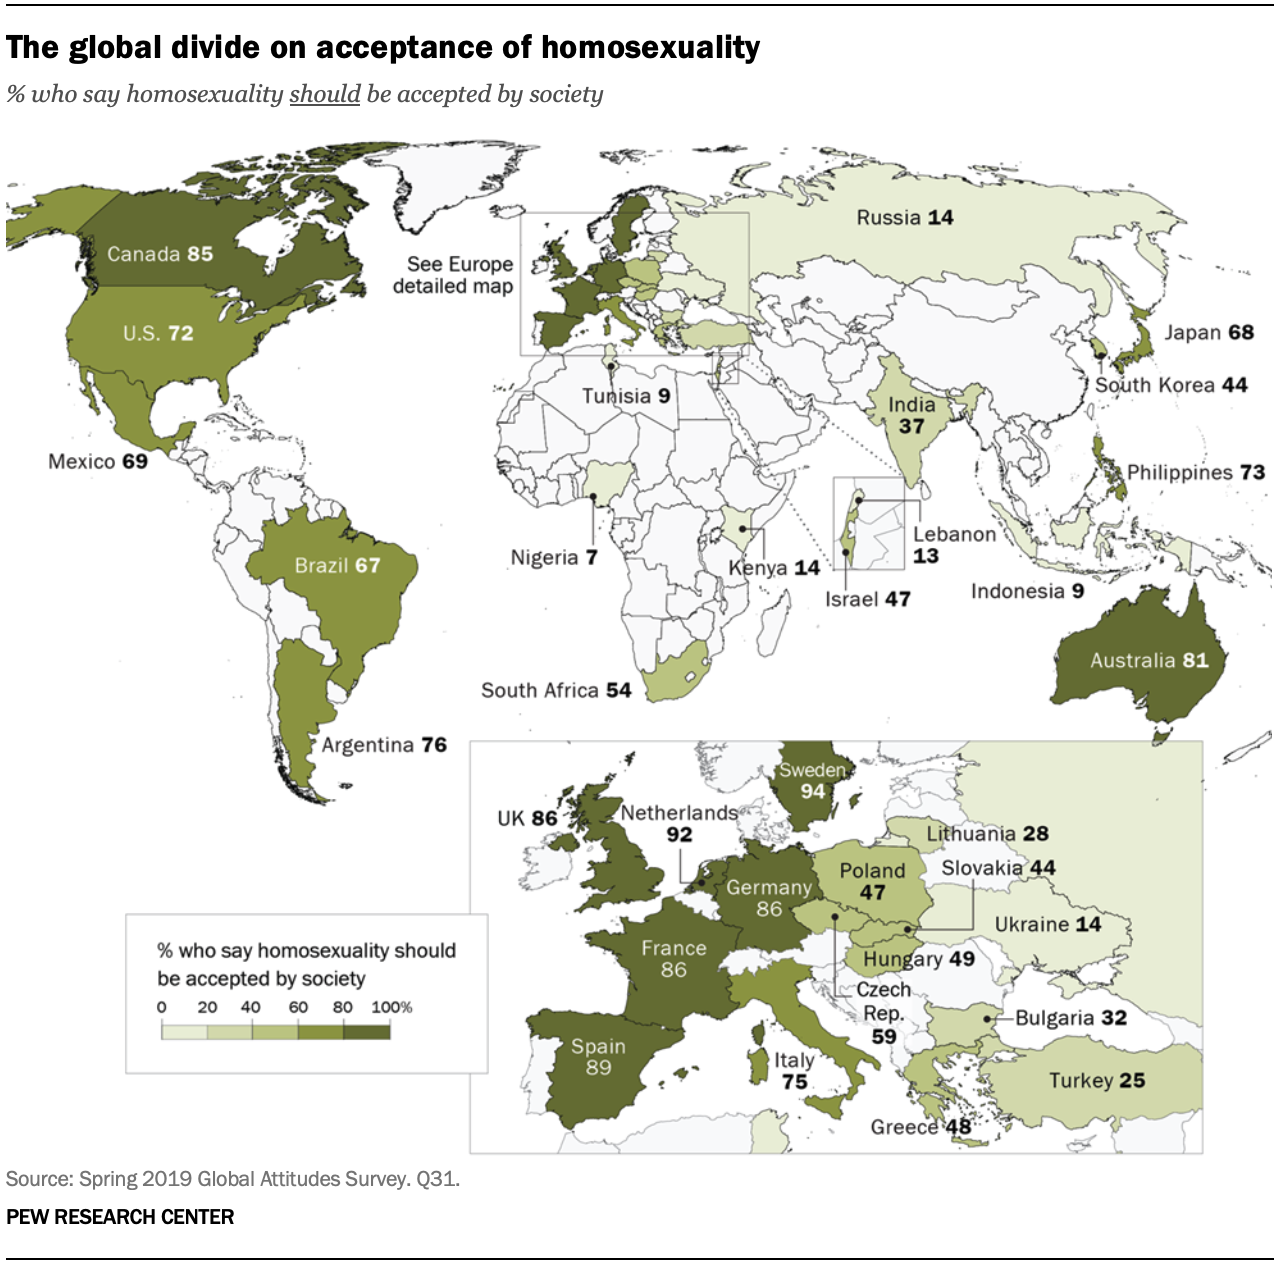
I decided to use this great dataset to see by myself the trends towards diversity over the past two decades.
Steps to do these analyses
Data Collection
I got the data from Pew Research Centre
The question I want to explore is: how is diversity perceived across different countries
This is the question is located the survey dataset
get_spss_label(dataset, 10)## [1] "Q8. Do you think this is a good thing or a bad thing for (survey country)?"names(dataset)[10]## [1] "diversity20yr_fu"Data visualization
dataset %>%
  select(diversity20yr_fu,COUNTRY) %>%
  group_by(COUNTRY,diversity20yr_fu) %>%
  tally  %>%
  group_by(COUNTRY) %>%
  mutate(pct=(100*n)/sum(n)) %>%
  filter(diversity20yr_fu %in% c("Good thing","Bad thing")) %>%
  ggplot(aes(pct,fct_reorder(COUNTRY,pct,.fun=max),label=paste0(round(pct, 0), "%"))) +
  geom_segment(aes( xend = pct, yend = COUNTRY)) +
  geom_point(aes(color = diversity20yr_fu),size = 5) +
  geom_text(color = "white", size = 2)+
  scale_color_manual(values = wes_palette("Royal1"))+
  scale_x_continuous(labels =function(l) {
    paste0(l,"%")}, limits=c(0,100)) +
  #geom_text(aes(label = diversity20yr_fu, size = 8, vjust =-1)) +
  geom_text(aes(x = 8, y = "Indonesia", label = "Bad thing"),
  color = wes_palette("Royal1")[2], size = 4, family = "", vjust = 2) +
  geom_text(aes(x = 85, y = "Indonesia", label = "Good thing"),
  color = wes_palette("Royal1")[1], size = 4, family = "", vjust = 2) +
  labs(title=gsub("this","diversity",gsub("\\(survey country\\)",
  "your country",get_spss_label(dataset, 10))), y="", x="",
  subtitle = "% who say diversity is a good or a bad thing",
  caption="Source:   Pew-Research-Center-Spring-2018") +
    theme_classic()+
  theme(
      legend.position = "none",
      plot.title=element_text(size=10, family=""),  # title
      plot.title.position = "plot",
      plot.subtitle = element_text(face = "italic", size = 10),
      plot.caption=element_text(size=8),  # caption
      #plot.caption.position = "plot",
      axis.title.x=element_text(size=10),  # X axis title
      axis.title.y=element_text(size=10),  # Y axis title
      axis.text.x=element_text(size=10),  # X axis text
      axis.text.y=element_text(size=10),
plot.margin = margin(2,50,5,25)) 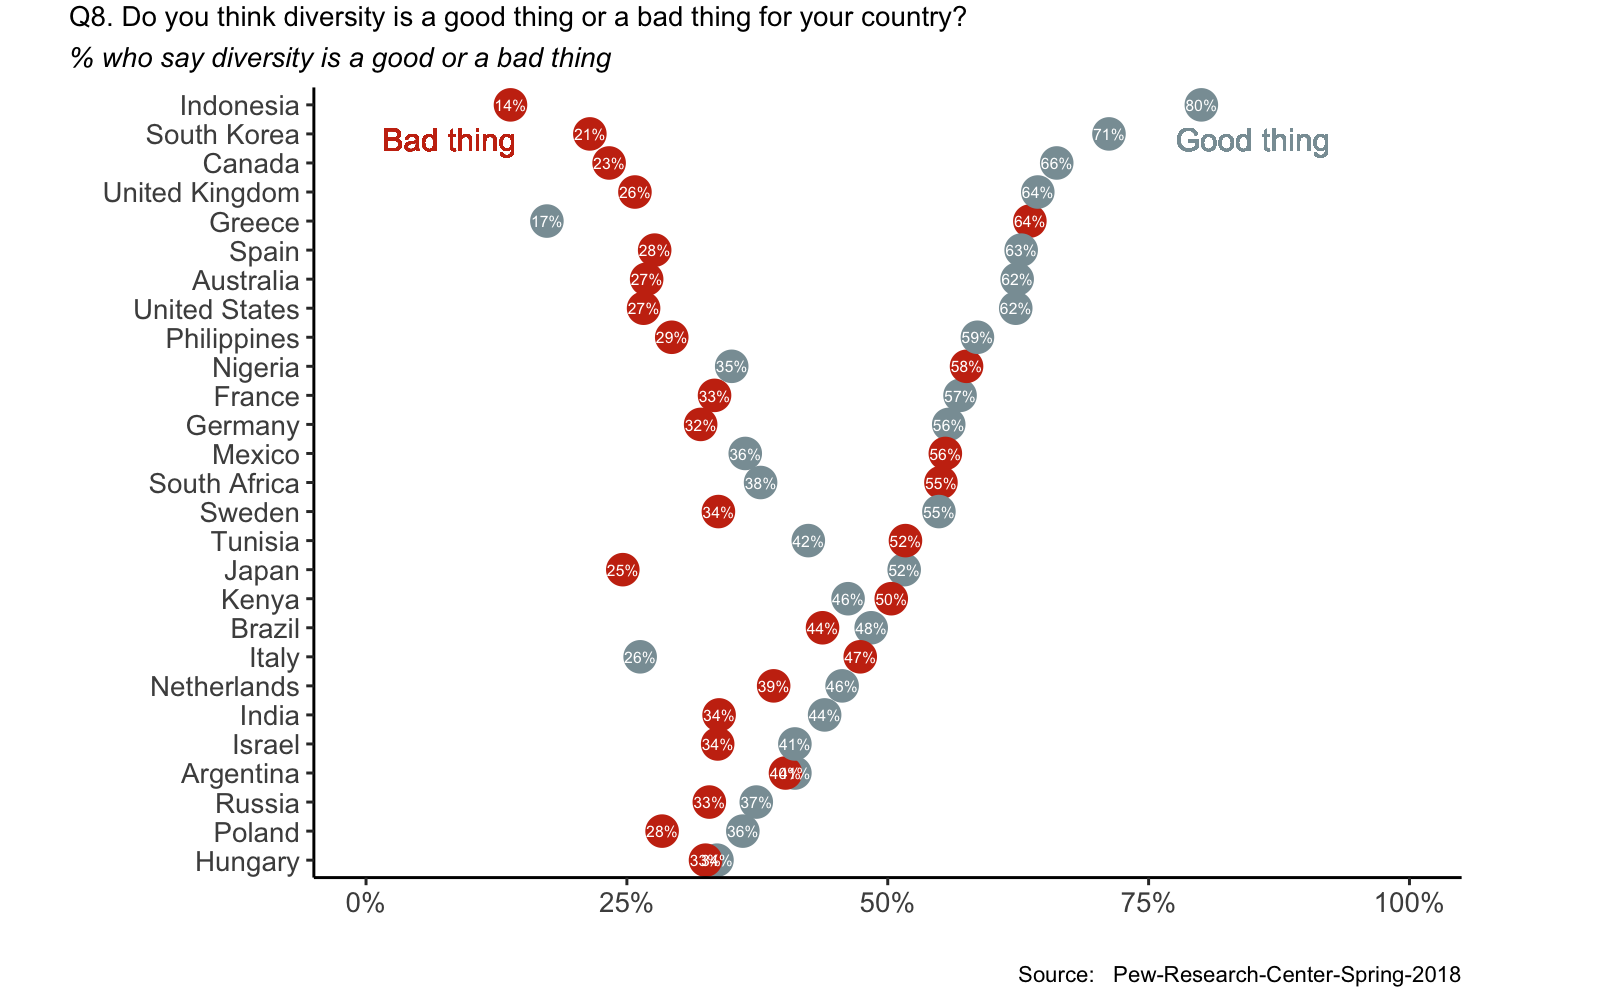
Conlusions
It looks like there are some countries with more polarised views on Diversity such as Indonesia and South Korea, and other countries such as Hungary and Poland where diversity is considered as neither a good or a bad thing.
Interestingly, some countries consider diversity mostly as a bad thing(such as Greece and Nigeria).
There are several other factors analysed in the survey such as education, religion, income etc, and those factors are associated with some of the replies of this survey.
© 2020 GitHub, Inc.


